
Application
note
Organoids are three-dimensional structures that closely mimic human tissues, making them essential in cancer research for replicating tumor characteristics and assessing personalized treatments.
To assess treatment efficacy, organoids are imaged and analyzed for quantity, morphology, and health status. TRI's VAIDR system uses AI to automate this process, completing in seconds what once required tedious manual evaluation.
Background
Organoids are three-dimensional, miniature organ-like structures composed of different cell lineages, unlike spheroids, which typically originate from a single cell line1. Their complex cell-to-cell interactions closely mimic the architecture and function of human tissues and organs. Organoids can be derived directly from a patient's tissue2, making them essential in cancer research for replicating the histological, genomic, and molecular characteristics of tumors3. This makes them valuable for exploring potential cancer treatments and assessing their clinical applicability, particularly in the context of personalized medicine2. Additionally, organoids reduce the need for animal trials, offering ethical benefits and addressing the challenges of transferring findings from animal models to human applications4. However, to fully evaluate novel immunotherapeutic strategies, it is crucial to consider the immunological microenvironment, as it plays a key role in tumor development and progression5.
VAIDR: A Flexible AI Platform Revolutionizing Image Analysis
Most algorithms are specialized to address a single problem, such as segmenting organoids, and cannot be easily adapted for other purposes, like segmenting different cell types. While this specialization ensures the integrity of the results, it lacks flexibility and requires significant time and expertise to develop such algorithms, and the resulting tools are typically tailored to answer only the initial question.
This is where VAIDR comes into play. VAIDR is a user-trainable AI platform designed to facilitate image analysis. It offers a distinct advantage by being customizable to the specific research question. By training VAIDR on the feature of interest, biologists can focus solely on the biological content, with VAIDR handling the rest. Structures of interest are simply highlighted on the simple user interface of the platform, and the software learns to detect them. VAIDR saves time, costs, and effort while simplifying the labeling process.
Furthermore, VAIDR includes tools for analyzing and plotting results, making it a comprehensive solution. The plots are generated in a uniform format, ensuring consistency and ease of interpretation.
It could thereby advance the field of organoid-based therapeutic assessment. The label-free approach is advantagous as it enables continuous monitoring of organoid responses over time without disturbing the organoid system.
Key Advantages of VAIDR
- Fexibility: VAIDR can be applied for various research questions by labeling the feature of interest
- User-Friendly: the simple user interface allows researchers to solely focus on the biological content without requiring code knowledge
- Time and Effort Savings: VAIDR reduces time, cost, and effort needed for image labeling and analysis by using automated processes
- Integrated Analysis Tools: VAIDR offers a wide variety of build-in tools for plotting results
Methods
Kulkarni et al. have introduced a dataset comprising organoids derived from Pancreatic Ductal Adenocarcinoma, co-cultured with immune cells. This dataset, the first of its kind, offers a valuable benchmark for organoid segmentation protocols as the presence of immune cells makes the segmentation more complex6.
We used VAIDR’s UI to label the images with the expert-annotated masks serving as a reference (Fig 1).Upon completion of the training process, a morphological analysis was performed to segment organoids from the background.
This segmentation provides data sheets with information such as the number of detected objects in each image, their area, and other morphological features. These data can be easily plotted to visualize and analyze changes over time in VAIDR, requiring no additional data analysis skills.

Counting organoids
A primary application of trainable AI in image segmentation is the quantification of objects within images as it saves a lot of time and effort.
Fig 1 illustrates a comparison between the organoids detected by VAIDR (left) and those identified in the reference masks (right). A high level of concordance is observed between the organoids identified by VAIDR and those in the reference masks. In the analysis, VAIDR successfully identified all organoids within the mask, except for two organoids marked by a dark red dashed line. These organoids were excluded from the analysis because they touch the border of the image, making it impossible to calculate parameters such as area etc. Consequently, they were omitted from the results. Additionally, VAIDR detected more organoids, highlighted by blue circles, that are not present in the masks. This discrepancy raises the question of whether these are instances of false positives by VAIDR or if they were overlooked by the experts during the labeling process. This illustrates a problem with human-generated, and therefore noisy, ground truth as a reference.
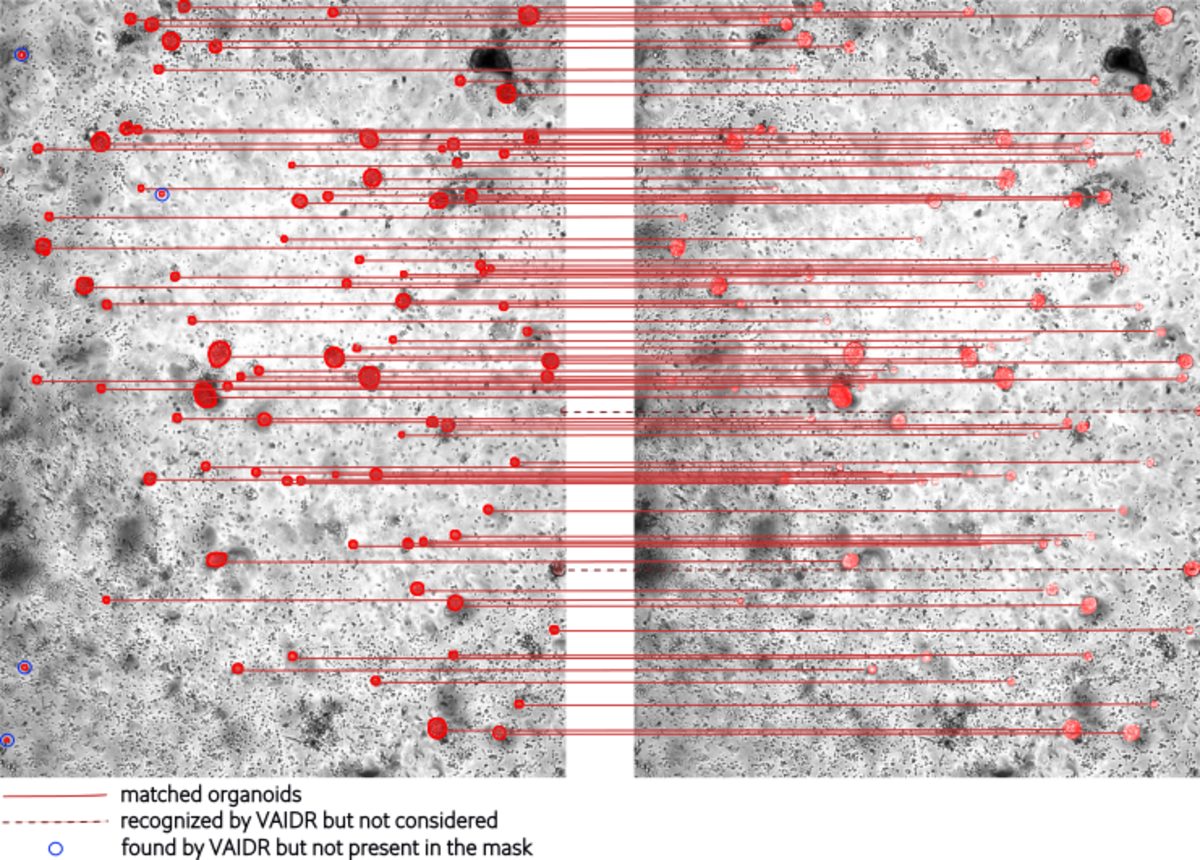
Fig 2: Matched organoids by VAIDR (left) and the masks (right). The left image displays the organoids identified by VAIDR, while the right image shows the organoids labeled in the masks. Organoids that match between the two images are connected by a red line. The dark red dashed line indicates organoids that are correctly recognized by VAIDR but are excluded from the analysis because they touch the image border, making it impossible to calculate parameters such as area etc. Additionally, organoids identified exclusively by VAIDR are circled in blue.
This is further demonstrated in the accompanying plots (Fig 3), which compare VAIDR's organoid counts to the ground truth for each donor. VAIDR successfully mirrors the trends characterized by the ground truth over time. However, the analysis of mouse samples proved more challenging. This difficulty likely arises due to the high density of organoids, which complicates the identification of individual organoids as they are often perceived as a single entity.

Fig 3: Organoid counts over time for each donor. Organoid counts for (A) Human 1, (B) Human 2, (C) Human 3, (D) Human 4, (E) Mouse 1, (F) Mouse 2. VAIDR closely mirrors the trend characterized by the ground truth over time. However, the analysis of mouse samples reveals greater discrepancies, likely due to the high density of organoids, which complicates the identification of individual organoids.
Despite these challenges, when the correlation is plotted (Fig 4), it becomes evident that VAIDR’s predictions are highly accurate. It also highlights that segmenting human images from this study is comparatively easier than segmenting mouse images as the correlation for human images is higher than the correlation for the mouse images.

Fig 4: Correlation of organoid counts between the ground truth and VAIDR. Correlation analysis was conducted for (A) human images and (B) mouse images. The predictions by VAIDR demonstrate high accuracy overall. However, segmenting human images appears to be easier compared to mouse images, suggesting that VAIDR performs better with human data, likely due to the less complex nature of the images.
Dot - Placing
For the purpose of simply counting organoids it may be of interest to use a dot-placing approach - a simplified form of image segmentation - to overcome the problem of merged segmented regions when separate countable objects are in close proximity.
Instead of labeling the entire organoid, individual dots are placed to represent each organoid. This method significantly reduces time and complexity. However, you can’t derive morphological details such as area, elongation, and compactness.
It proved to be beneficial to adjust the size of the dots to match the size of the organoids, as placing a small dot within a large organoid can lead to it not being recognized later.
This can be explained by the fact that VAIDR screens the image in grids, which limits its ability to entirely evaluate large organoids. The border appears to play a significant role in dot placement, as most dots are positioned near the boundary. When the window scans the border of a large organoid, it may suggest that the dot should be placed further inward. However, if the window is located in the middle of the organoid, it resembles the background, and no clear border is detected, resulting in the organoid not being labeled at all.
To compare the two approaches in terms of counting accuracy, we evaluated the results of standard organoid segmentation against the dot-placing method labeling a similar amount of imgaes.


When comparing the overall correlation between it shows that the dot-placing approach is more accurate. This can be attributed to the fact that organoids lying in close proximity to each other are labeled as individual organoids and are therefore recognized as such. Especially in the case of mouse images, where normal segmentation proved to be difficult due to the densely packed organoids, an increase in correlation from 0.892 to 0.962 was observed. This improvement shows the clear advantage of dot placing, allowing for more accurate identification of individual structures in complex, crowded areas. In contrast, the correlation for human images remains consistent. Despite this, both approaches perform well, and depending on the specific question being addressed, either method can be appropriate.
Tracking Organoids
Tracking individual organoids over time to observe their morphological changes in response to therapeutic interventions is of particular interest. This requires matching organoids across different time points in the images, enabling the analysis of their properties—such as area, compactness, elongation, and intensity—over the course of treatment.
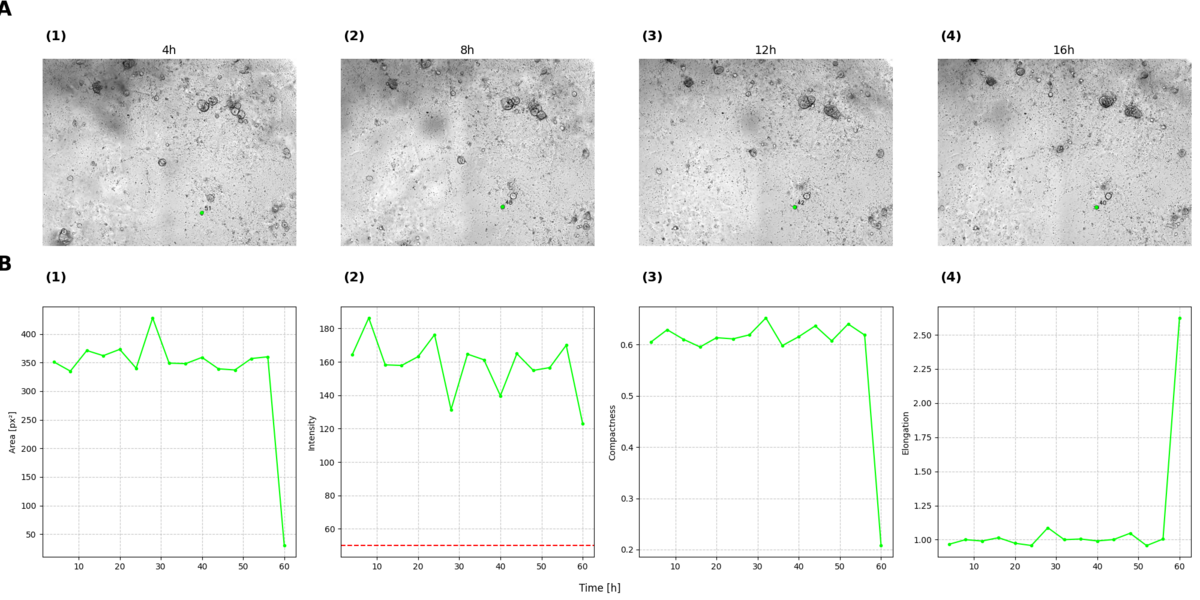
Fig 6: One organoid tracked over time. (A) Images showing the organoid at the different time points: (1) 4h, (2) 8h, (3) 12, (4) 16. (B) Parameters plotted over time for the organoid. Panels (A) Area, (B) Intensities, (C) Compactness, and (D) Elongation are plotted over time for the organoid. In the intensity plot, the red line represents a threshold set at 50, based on the findings of Kulkarni et al. [5], to determine the health status of the organoid. An organoid with an intensity value above this threshold is considered healthy, while a value below it indicates an unhealthy organoid. When examining the progression of these parameters over time, it is evident that they remain relatively steady until the 60-hour mark, where significant changes occur, indicating a major event affecting the organoid's condition.
As an example one organoid was selected and tracked over time. Figure 4 illustrates the organoid at the first four time points, while Figure 5 displays its properties over the entire duration in which the organoid could be tracked. This approach allows for a detailed investigation of the organoid's condition, providing insights such as its health status. For instance, significant changes in the organoid's properties are observed at time point 60, indicating a major event that likely impacted its condition.
Discussion
Upon reviewing the images with the most pronounced discrepancies in organoid counts, specifically the early-stage mouse images, it becomes apparent that the high number of organoids - where organoids touch and overlap - presents a challenge. Another significant challenge is the presence of immune cells in the background, which complicates the segmentation process. These cells can interfere with accurate boundary detection and contribute to increased complexity in distinguishing between organoids and surrounding structures. This likely explains why VAIDR was unable to identify all individual organoids, as distinguishing between them becomes increasingly difficult in densely packed regions.
A solution to this challenge was the dot-placing approach, which proved to be more time-efficient while delivering outstanding result quality, particularly by increasing accuracy in the densely populated mouse images. However, this method comes with the trade-off of forgoing additional information, such as area, elongation, and compactness, which are typically provided by standard segmentation approaches.
Another approach could involve training the model to recognize borders by adding labels that mark the junctions between touching organoids. This method would help preserve data related to the area and morphology of the organoids. This approach is applicable when the organoids are merely touching, as the boundaries are more easily recognized. However, it is not suitable in this case because the organoids are overlapping. It is important to consider that with this approach, there may be slight alterations to these features, and not all borders might be accurately recognized due to its increased complexity. Additionally, this method requires more time for labeling.
It is important to recognize that ground truths themselves are subject to a degree of uncertainty, as they are also derived from human-generated annotations or measurements. This inherent limitation emphasizes the necessity of acknowledging potential biases or errors present in the data. However it could encourage contributional annotations from more experts that would enhance the ground truth quality. [3]

"Even as an intern, I could easily handle complex image analysis with VAIDR. It’s incredible how much detail you can uncover. Once you get started, you see endless opportunities and find yourself wanting to dive deeper and explore more with every analysis."
Kathrin Kreischer
Molecular Biotechnology Student (B.Sc.) at Heidelberg Univeristy, Intern at TRI
Summary
VAIDR has proven to be an indispensable tool for organoid segmentation and subsequent downstream analysis. The project could not have been completed in such a short time without VAIDR. Moreover, it offers a wide range of analytical options, allowing researchers to tailor the analysis to specific conditions and research questions.
References
- Gunti, S., Hoke, A.T.K., Vu, K.P., and London, N.R., Jr. (2021). Organoid and Spheroid Tumor Models: Techniques and Applications. Cancers (Basel) 13. doi.org/10.3390/cancers13040874.
- Zhou, Z., Cong, L., and Cong, X. (2021). Patient-Derived Organoids in Precision Medicine: Drug Screening, Organoid-on-a-Chip and Living Organoid Biobank. Frontiers in Oncology 11. doi.org/10.3389/fonc.2021.762184.
- National Cancer Institute. "Organoid." NCI Dictionary of Cancer Terms. Accessed 19.09.2024. https://www.cancer.gov/publications/dictionaries/cancer-terms/def/organoid.
- Mollaki, V. (2021). Ethical Challenges in Organoid Use. BioTech (Basel) dx.doi.org/10.3390/biotech10030012.
- Bogoslowski, A., An, M., and Penninger, J.M. (2023). Incorporating Immune Cells into Organoid Models: Essential for Studying Human Disease. Organoids 2, 140-155.
- Kulkarni, A., Ferreira, N., Scodellaro, R., Choezom, D., and Alves, F. (2024). A Curated Cell Life Imaging Dataset of Immune-enriched Pancreatic Cancer Organoids with Pre-trained AI Models. Scientific Data 11, 820. dx.doi.org/10.1038/s41597-024-03631-3.